

CDC Community Level Tracker
CDC Community Level Tracker
A New COVID-19 Community Level Tool to track relative risks
The CDC recently unveiled a new tool to help individuals and communities decide on what new prevention steps to take based on trending new data in their state, city, town, etc.
There are three different categorization levels (low, medium, high) and an interactive map for each individual to be able to locate their state and county to see how they are categorized based on new incoming COVID-19 data.
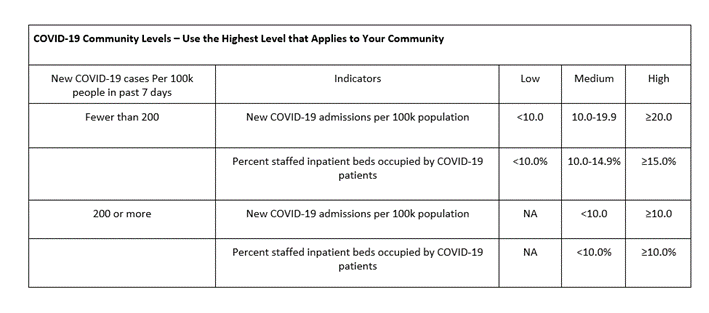
The data used to determine risk levels are based on hospital beds being used, hospital admissions, and total number of new COVID-19 cases in an area.
While we are not out of the pandemic yet, you can continue to take precautions by evaluating your county community level, talking to your state health department, and contacting your healthcare provider if you have questions about personal risk. This new tool is designed to help ease the US into the next phase of COVID-19 mitigation.
The CDC uses a combination of three metrics to determine the COVID-19 community level:
a. New COVID-19 admissions per 100,000 population in the last 7 days
b. Percent of staffed inpatient beds occupied by COVID-19 patients
c. Total new COVID-19 cases per 100,000 population in the past 7 days
Based on those numbers, the community is categorized as low, medium, or high according to the following:
Based on your community risk level, there are prevention steps you can take, both at an individual level, and within the community as a whole.
Keep reading with a 7-day free trial
Subscribe to Unbiased Science to keep reading this post and get 7 days of free access to the full post archives.